DORA Metrics Dashboard for GitHub Teams
Automatically measure deployment frequency, lead time for changes, change failure rate, and mean time to recovery — directly from your GitHub repositories. No instrumentation required.
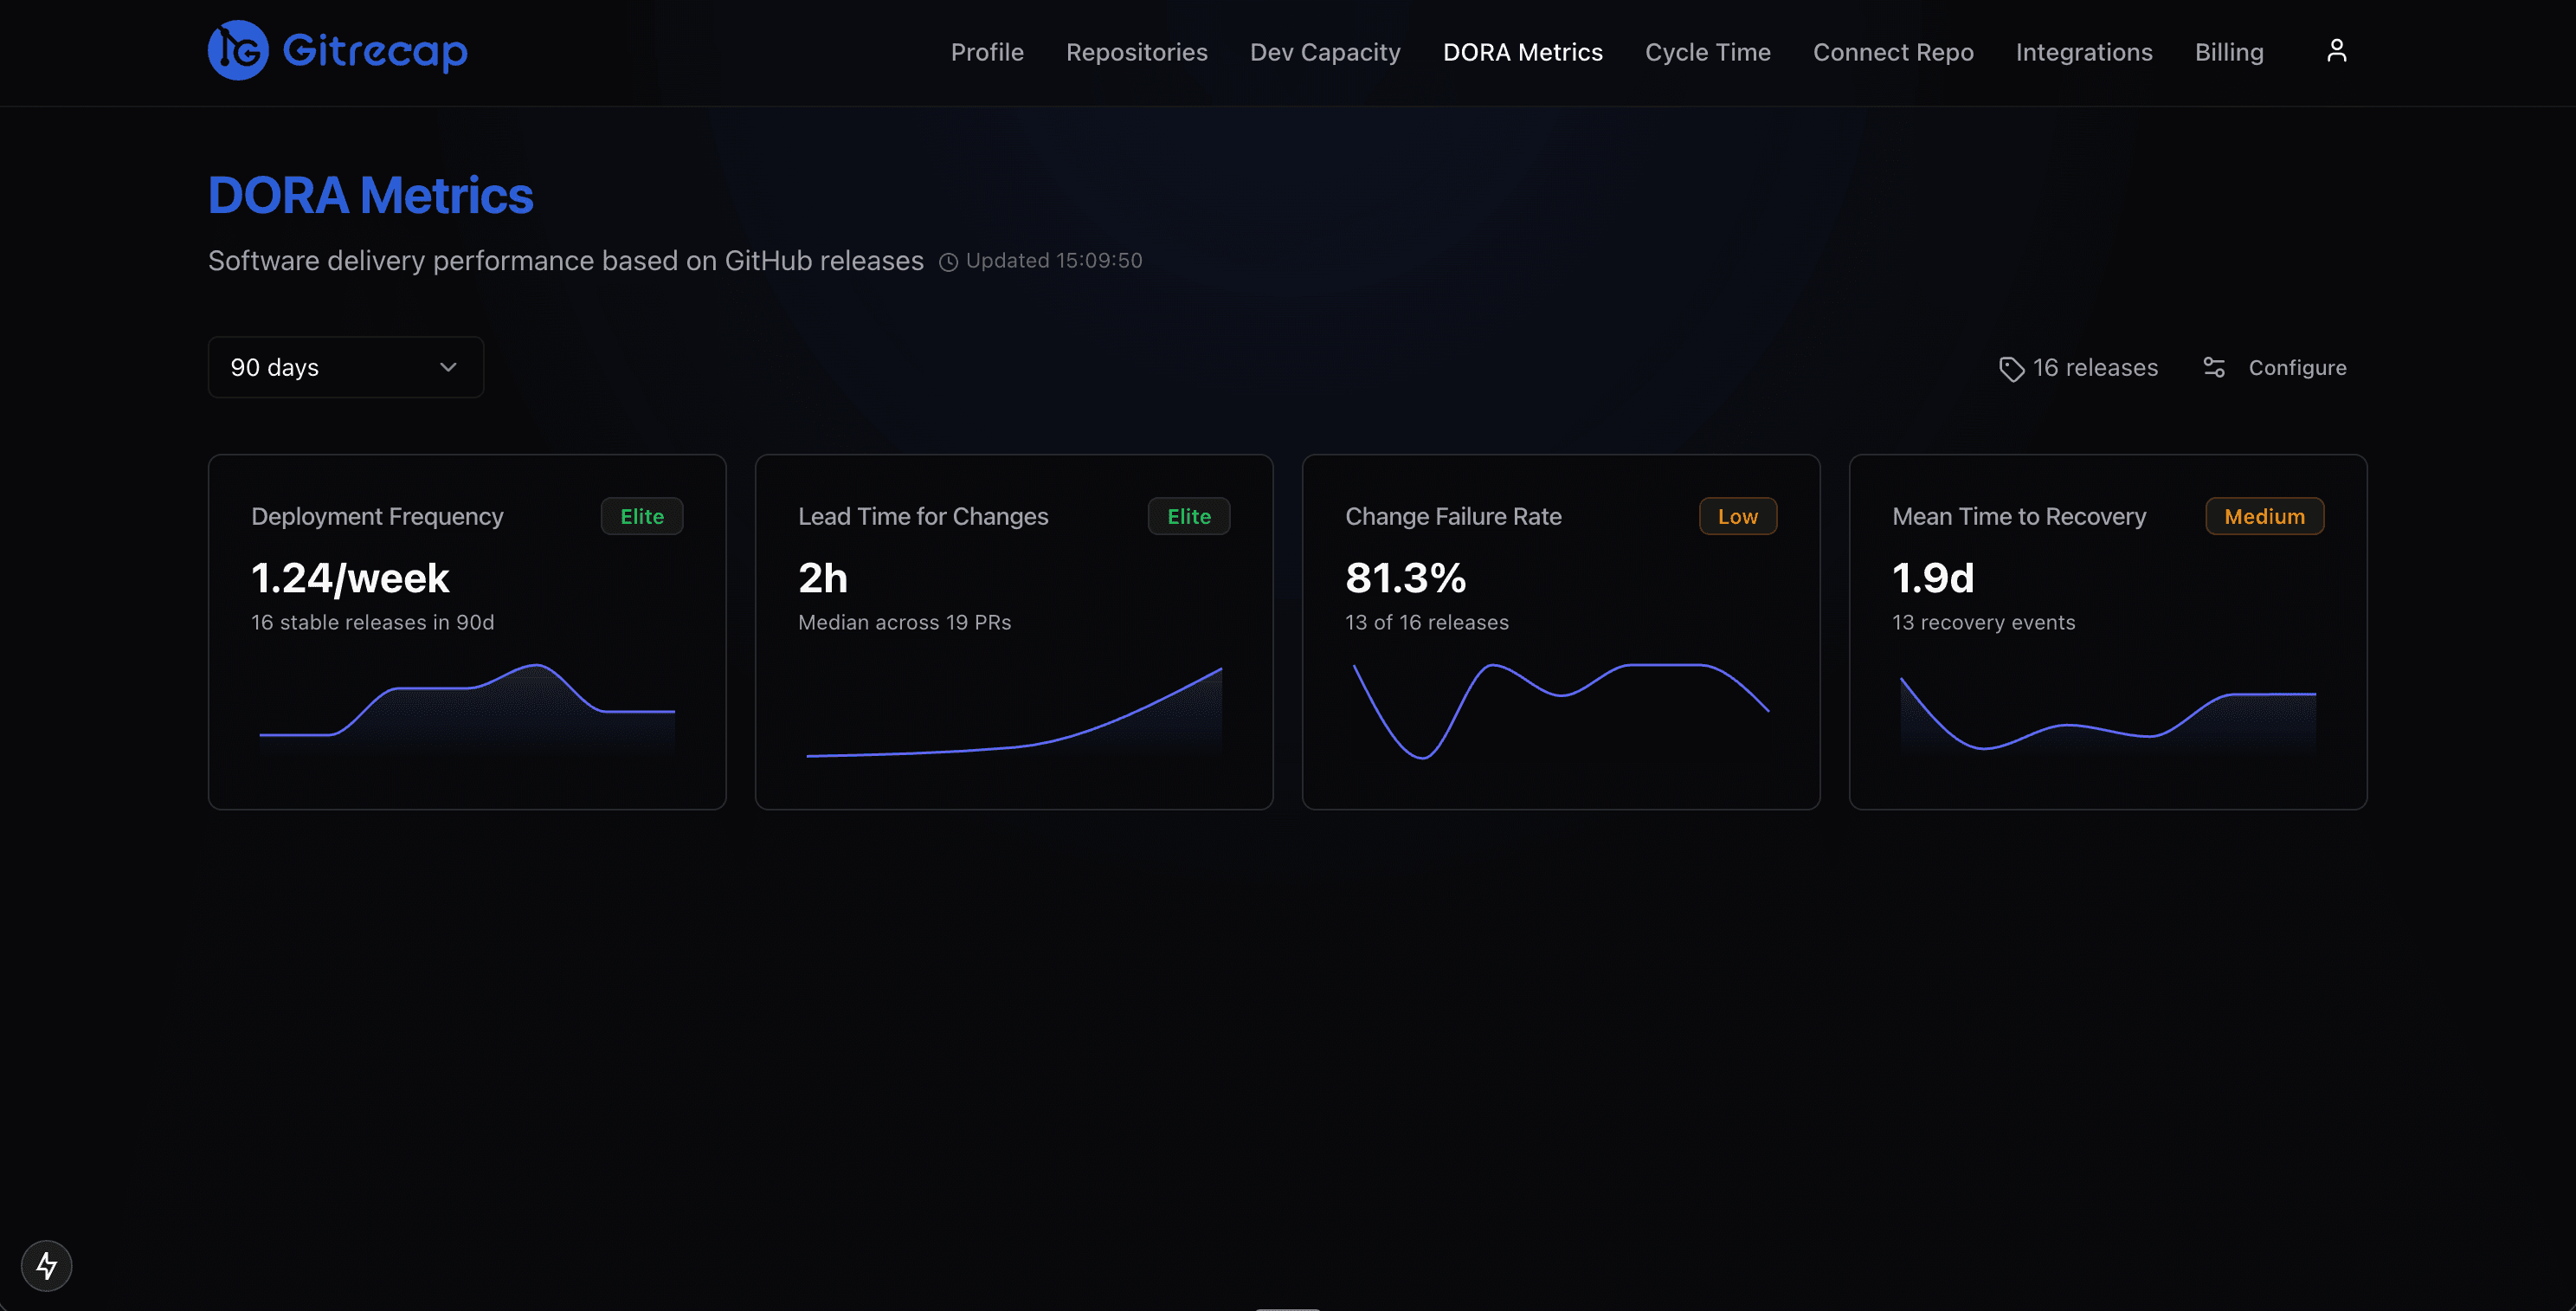
The Gitrecap DORA metrics dashboard — all four metrics computed automatically from GitHub data, with benchmark comparisons and 30-day trend charts.
What Are DORA Metrics?
DORA metrics are four key measurements of software delivery performance defined by Google's DevOps Research and Assessment (DORA) team. After more than a decade of research across 39,000+ software professionals, the DORA program identified these four metrics as the most reliable predictors of engineering team performance and organizational outcomes. Together, they measure two dimensions of software delivery: throughput (how fast you ship) and stability (how reliably you ship).
Deployment Frequency
How often your team successfully releases to production. Elite teams deploy multiple times per day. Gitrecap measures this from GitHub releases and deployment events.
What it measures
GitHub releases, deployment events, and tagged commits pushed to your main branch.
Lead Time for Changes
The time it takes for a commit to reach production. Shorter lead times mean faster feedback loops and more responsive teams.
What it measures
Time from the first commit on a branch to the associated pull request being merged and deployed.
Change Failure Rate
The percentage of deployments that cause a failure in production — requiring a hotfix, rollback, or patch. Lower is better; elite teams stay under 5%.
What it measures
Hotfix branches, reverted pull requests, and issues labeled as incidents relative to total deployments.
Mean Time to Recovery
How long it takes to restore service after a production failure. Fast-recovering teams resolve incidents in under an hour. This is a critical signal of operational resilience.
What it measures
Time from an incident being opened (via GitHub Issues or a revert PR) to the fix being deployed.
Each metric card shows your current value alongside the benchmark tier your team sits in.
Trend charts reveal patterns over time — spot regressions before they become problems.
DORA Metrics Benchmarks: How Does Your Team Compare?
The DORA research categorizes teams into four performance tiers — Elite, High, Medium, and Low — based on data from 39,000+ professionals. Use the table below to understand where your team stands and what Elite performance looks like for each metric.
| Metric | Elite | High | Medium | Low |
|---|---|---|---|---|
| Deployment Frequency | Multiple deploys per day | Weekly to monthly | Monthly to biannual | Less than once per 6 months |
| Lead Time for Changes | Less than 1 hour | 1 day to 1 week | 1 week to 1 month | More than 1 month |
| Change Failure Rate | 0–5% | 5–10% | 10–15% | More than 15% |
| Mean Time to Recovery | Less than 1 hour | Less than 1 day | 1 day to 1 week | More than 1 week |
Benchmark data based on the Google DORA State of DevOps research program.
Gitrecap overlays your actual numbers on the DORA benchmark ranges so you can see exactly where you stand.
At-a-glance performance tier badges let engineering leaders communicate delivery health quickly in standups and reviews.
How Gitrecap Measures Your DORA Metrics
Gitrecap reads directly from the GitHub API — releases, pull requests, commits, and issues — and applies the DORA definitions to compute each metric automatically. No webhook setup, no CI/CD plugin, no spreadsheet.
Deployment Frequency
Gitrecap counts GitHub Releases and GitHub Deployment events in your selected repositories. Each release or deployment to your production environment is treated as a deploy. The dashboard shows your deployment cadence as a daily and weekly rolling average so you can see whether your team is trending toward higher or lower frequency over time.
Deployment frequency card with trend histogram.
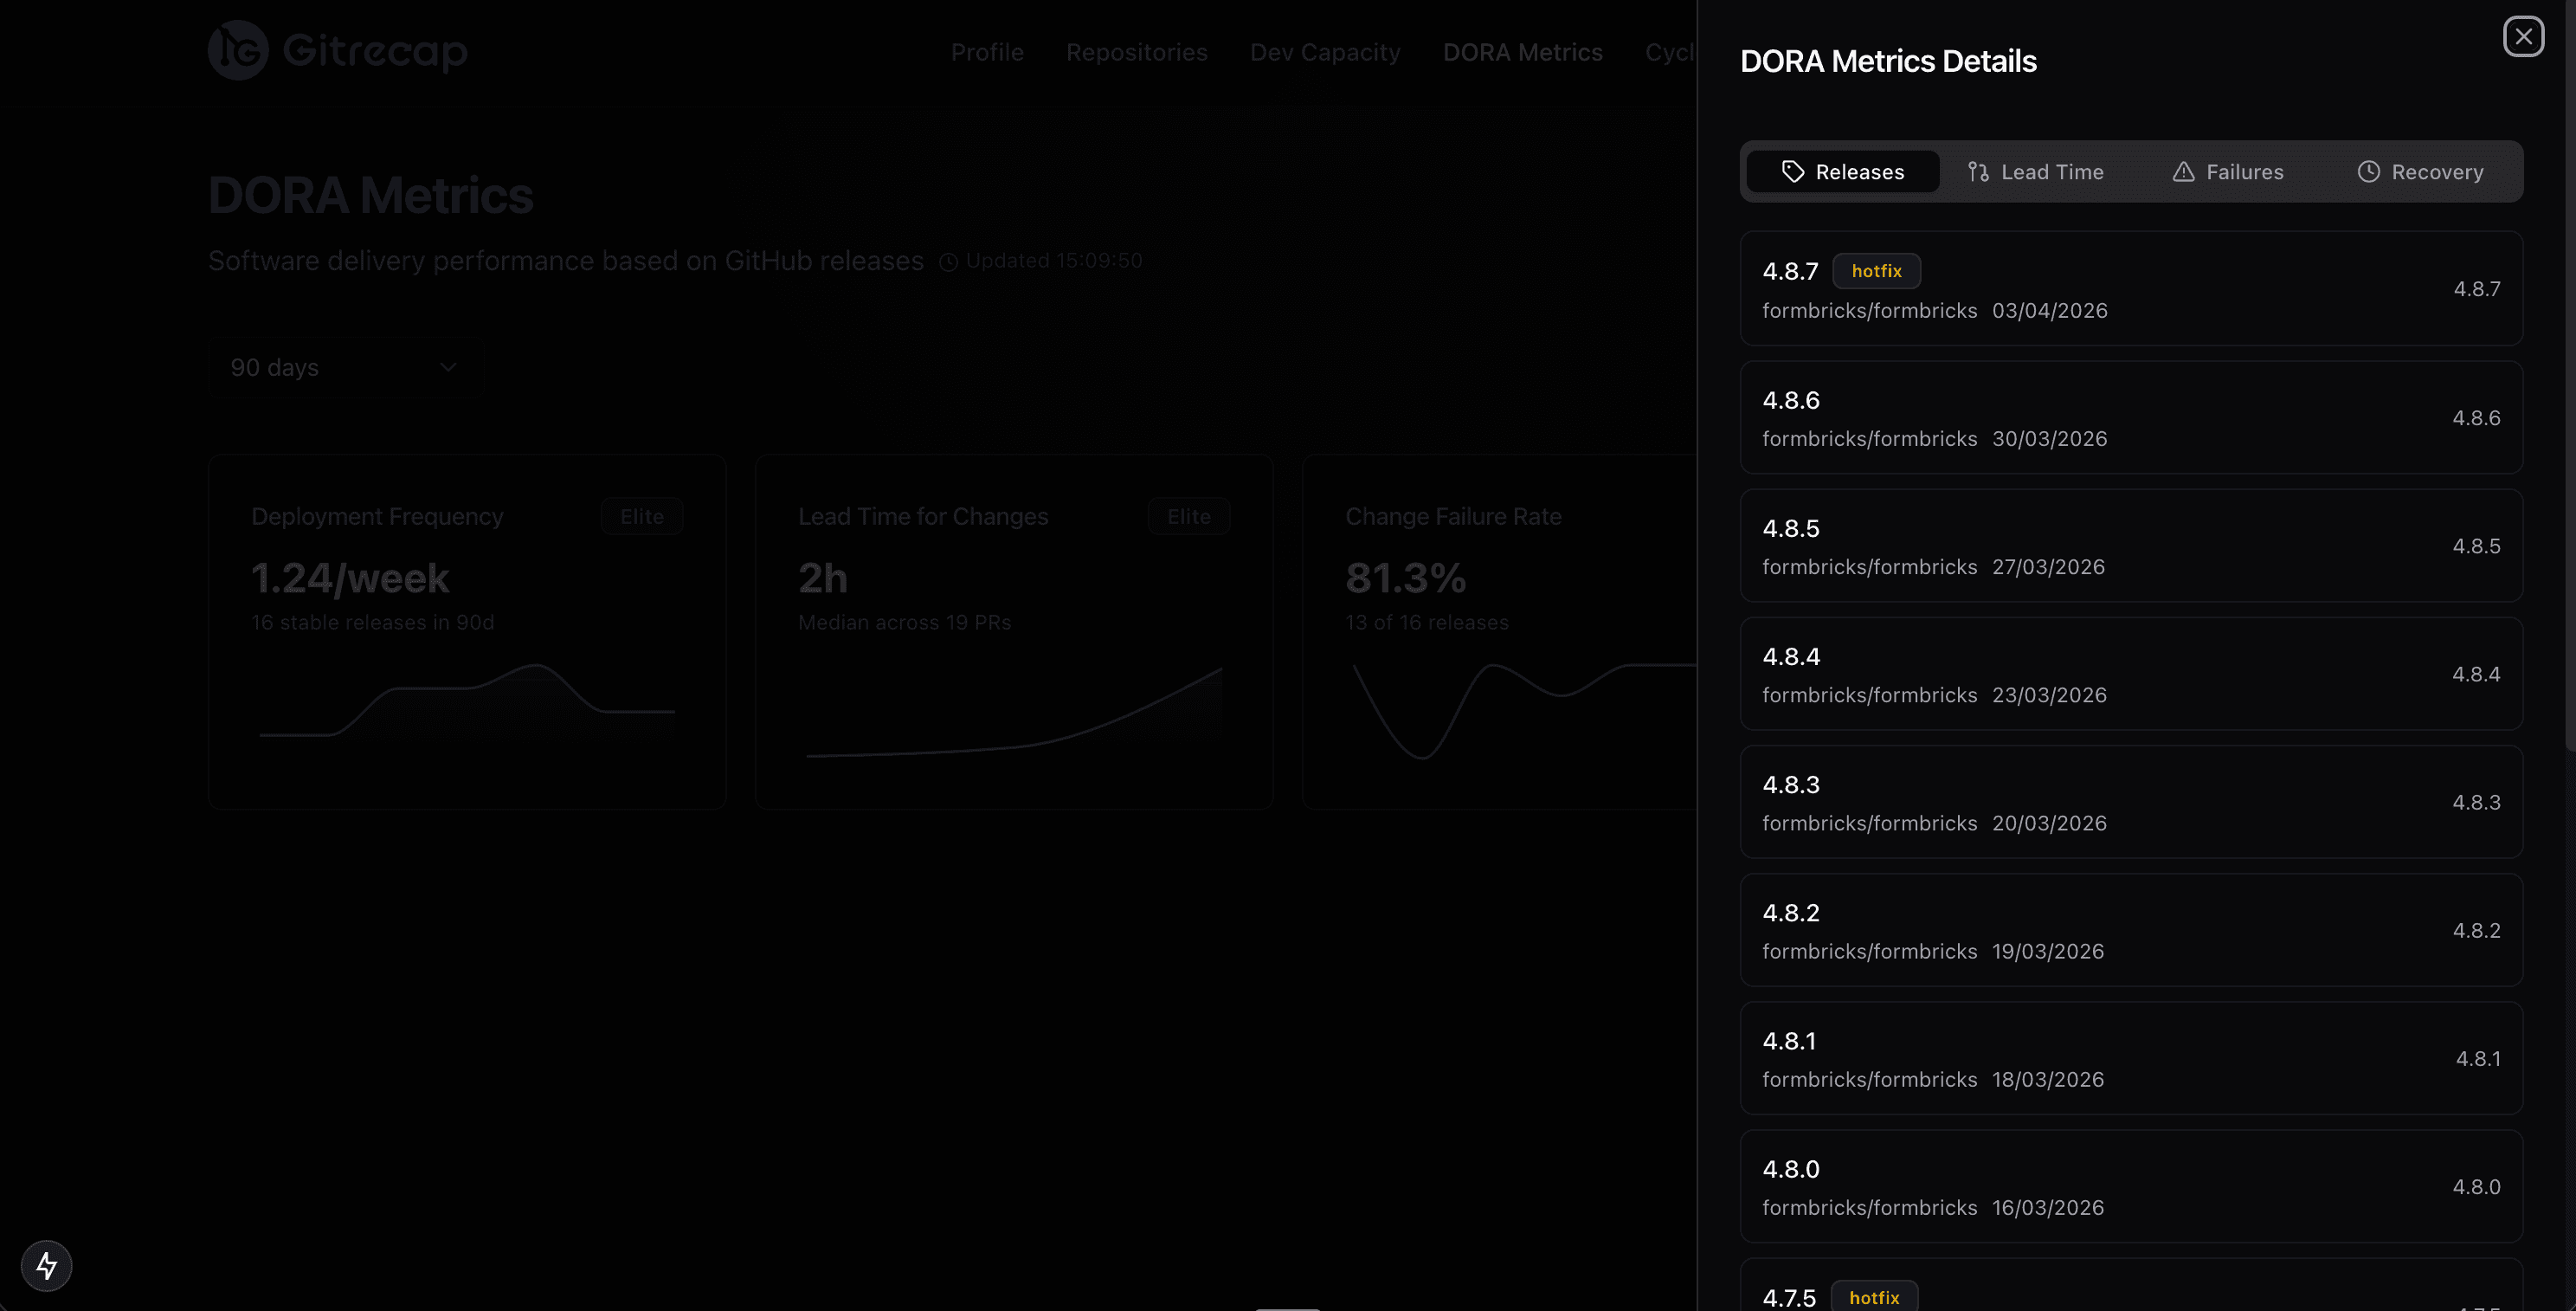
Drill into the individual releases powering the metric.
Lead Time for Changes
For each merged pull request, Gitrecap identifies the earliest commit timestamp in the branch and computes the elapsed time to the merge event. When the merged PR is associated with a release, that release timestamp is used as the end point. The dashboard shows mean and median lead time across all PRs in your selected date range, and surfaces the outlier PRs that are pulling your average up.
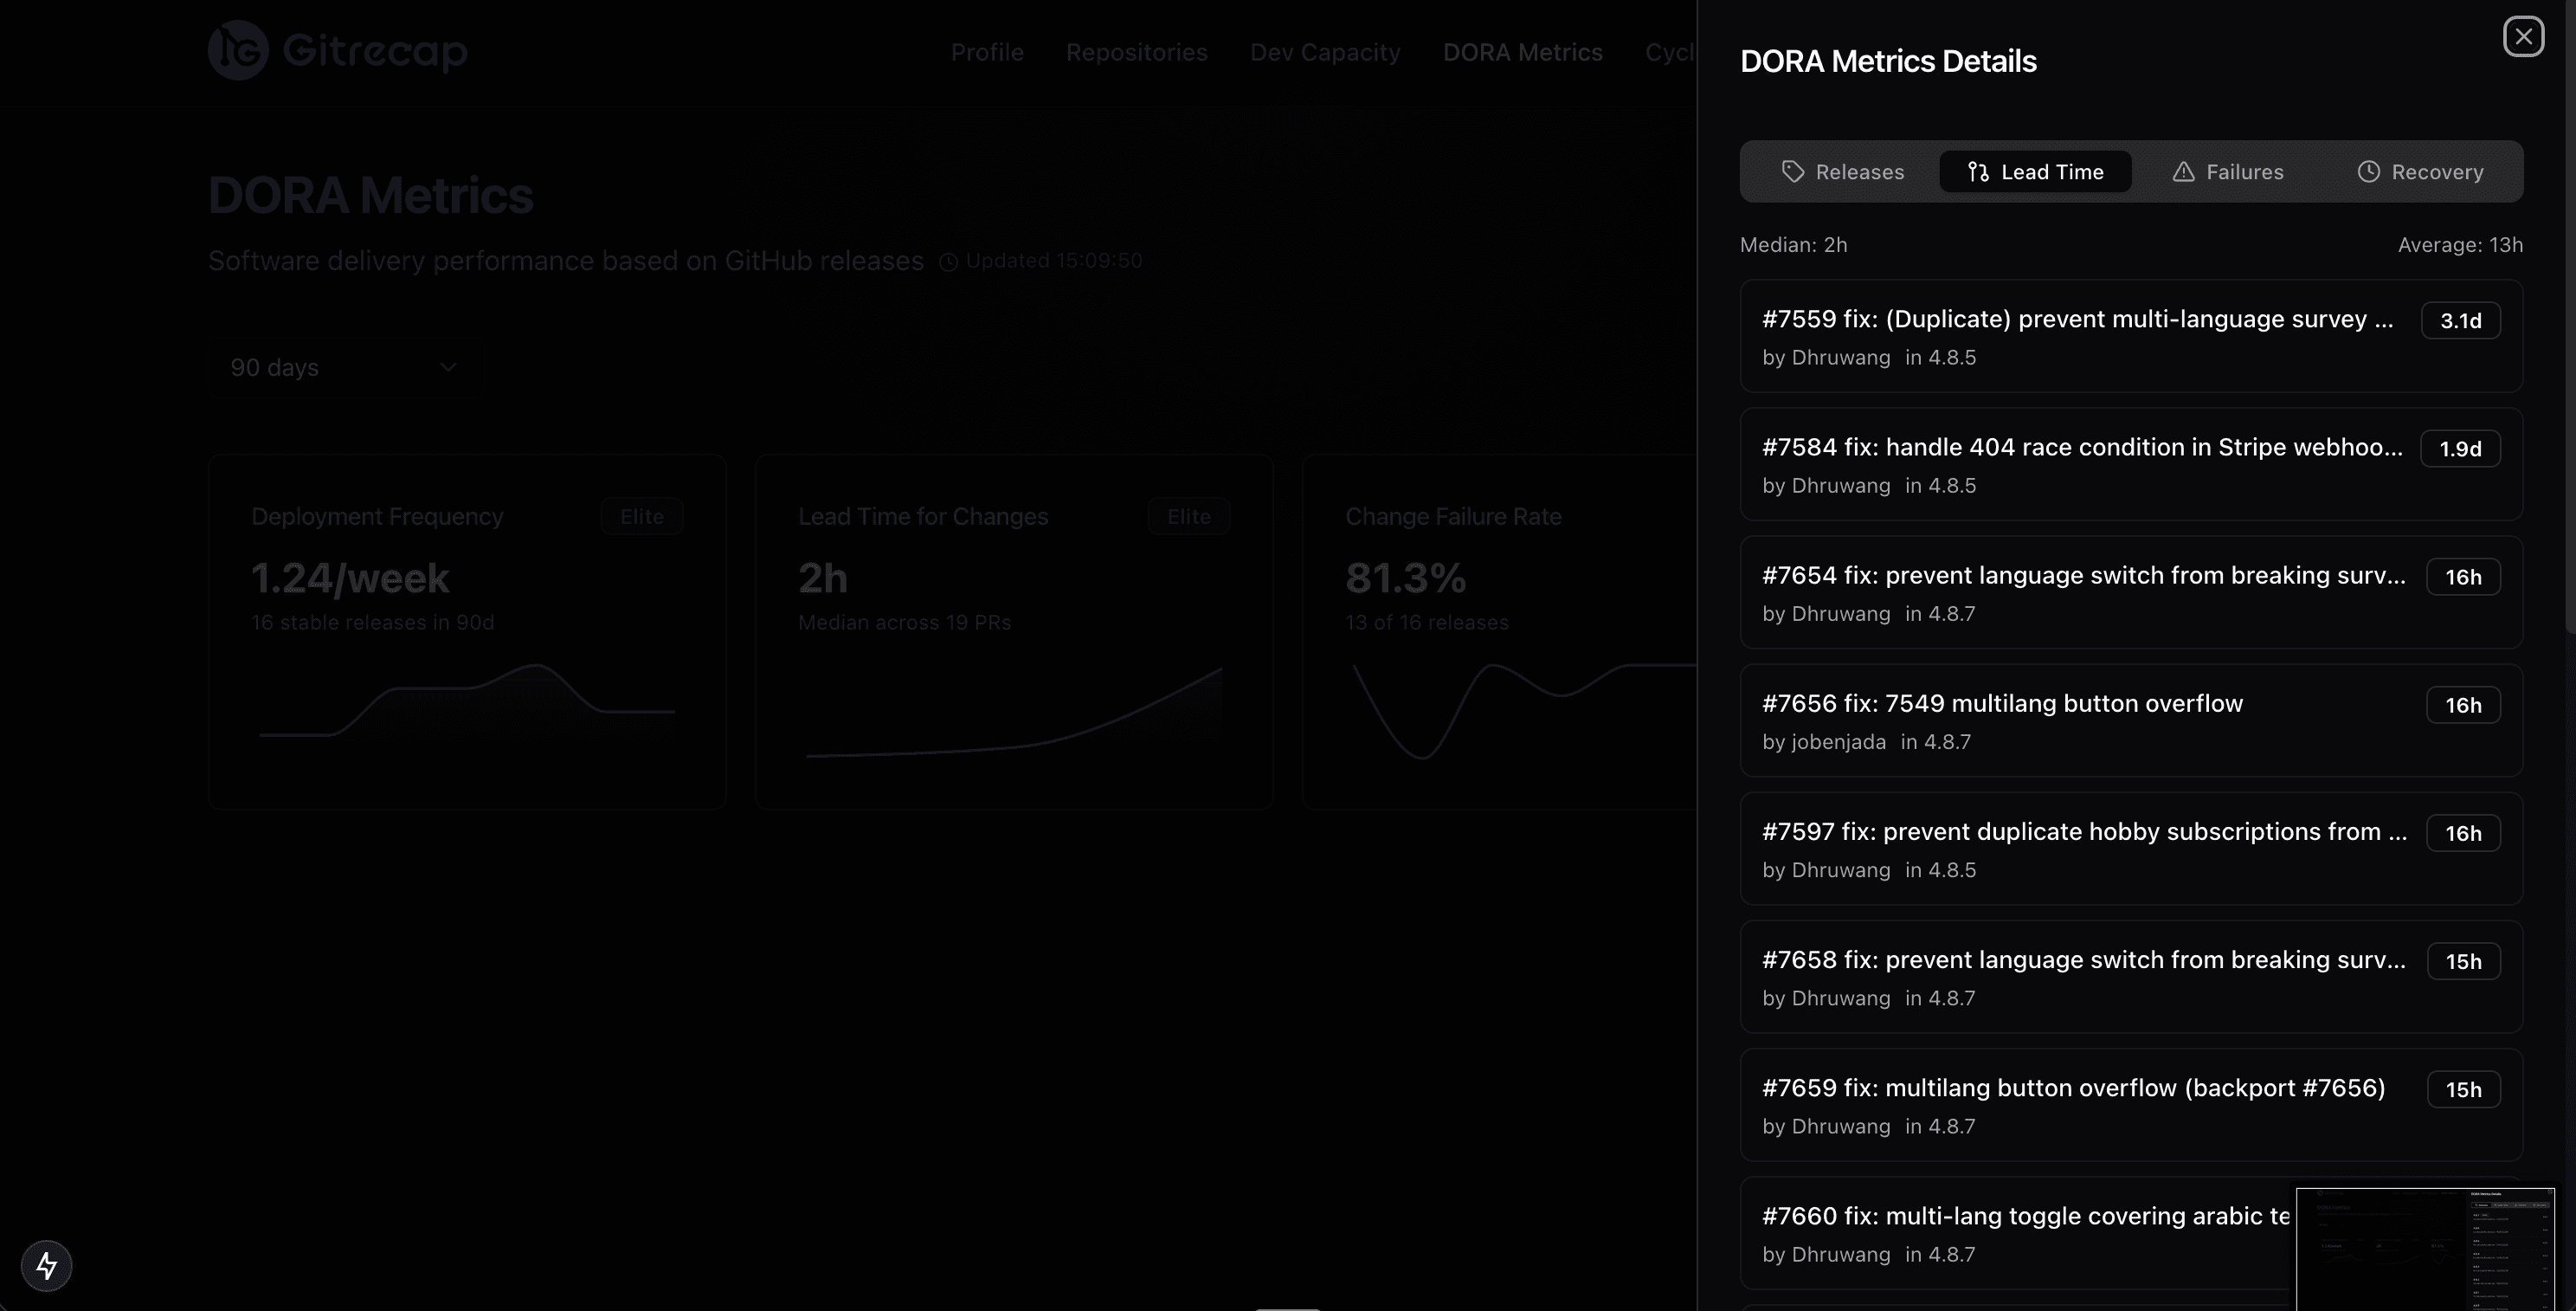
Mean and median lead time with a distribution histogram.
Identify the PRs that are dragging your lead time up.
Change Failure Rate
Gitrecap identifies failed deployments by detecting reverted pull requests, branches named with hotfix prefixes, and GitHub Issues labeled as incidents or bugs that were opened and closed within 24 hours of a release. It divides the number of failed deployments by your total deployments to produce your change failure rate as a percentage, shown alongside the benchmark range for your tier.
Change failure rate gauge with Elite/High/Medium/Low tier markers.
Review every failure event that contributed to your CFR.
Mean Time to Recovery
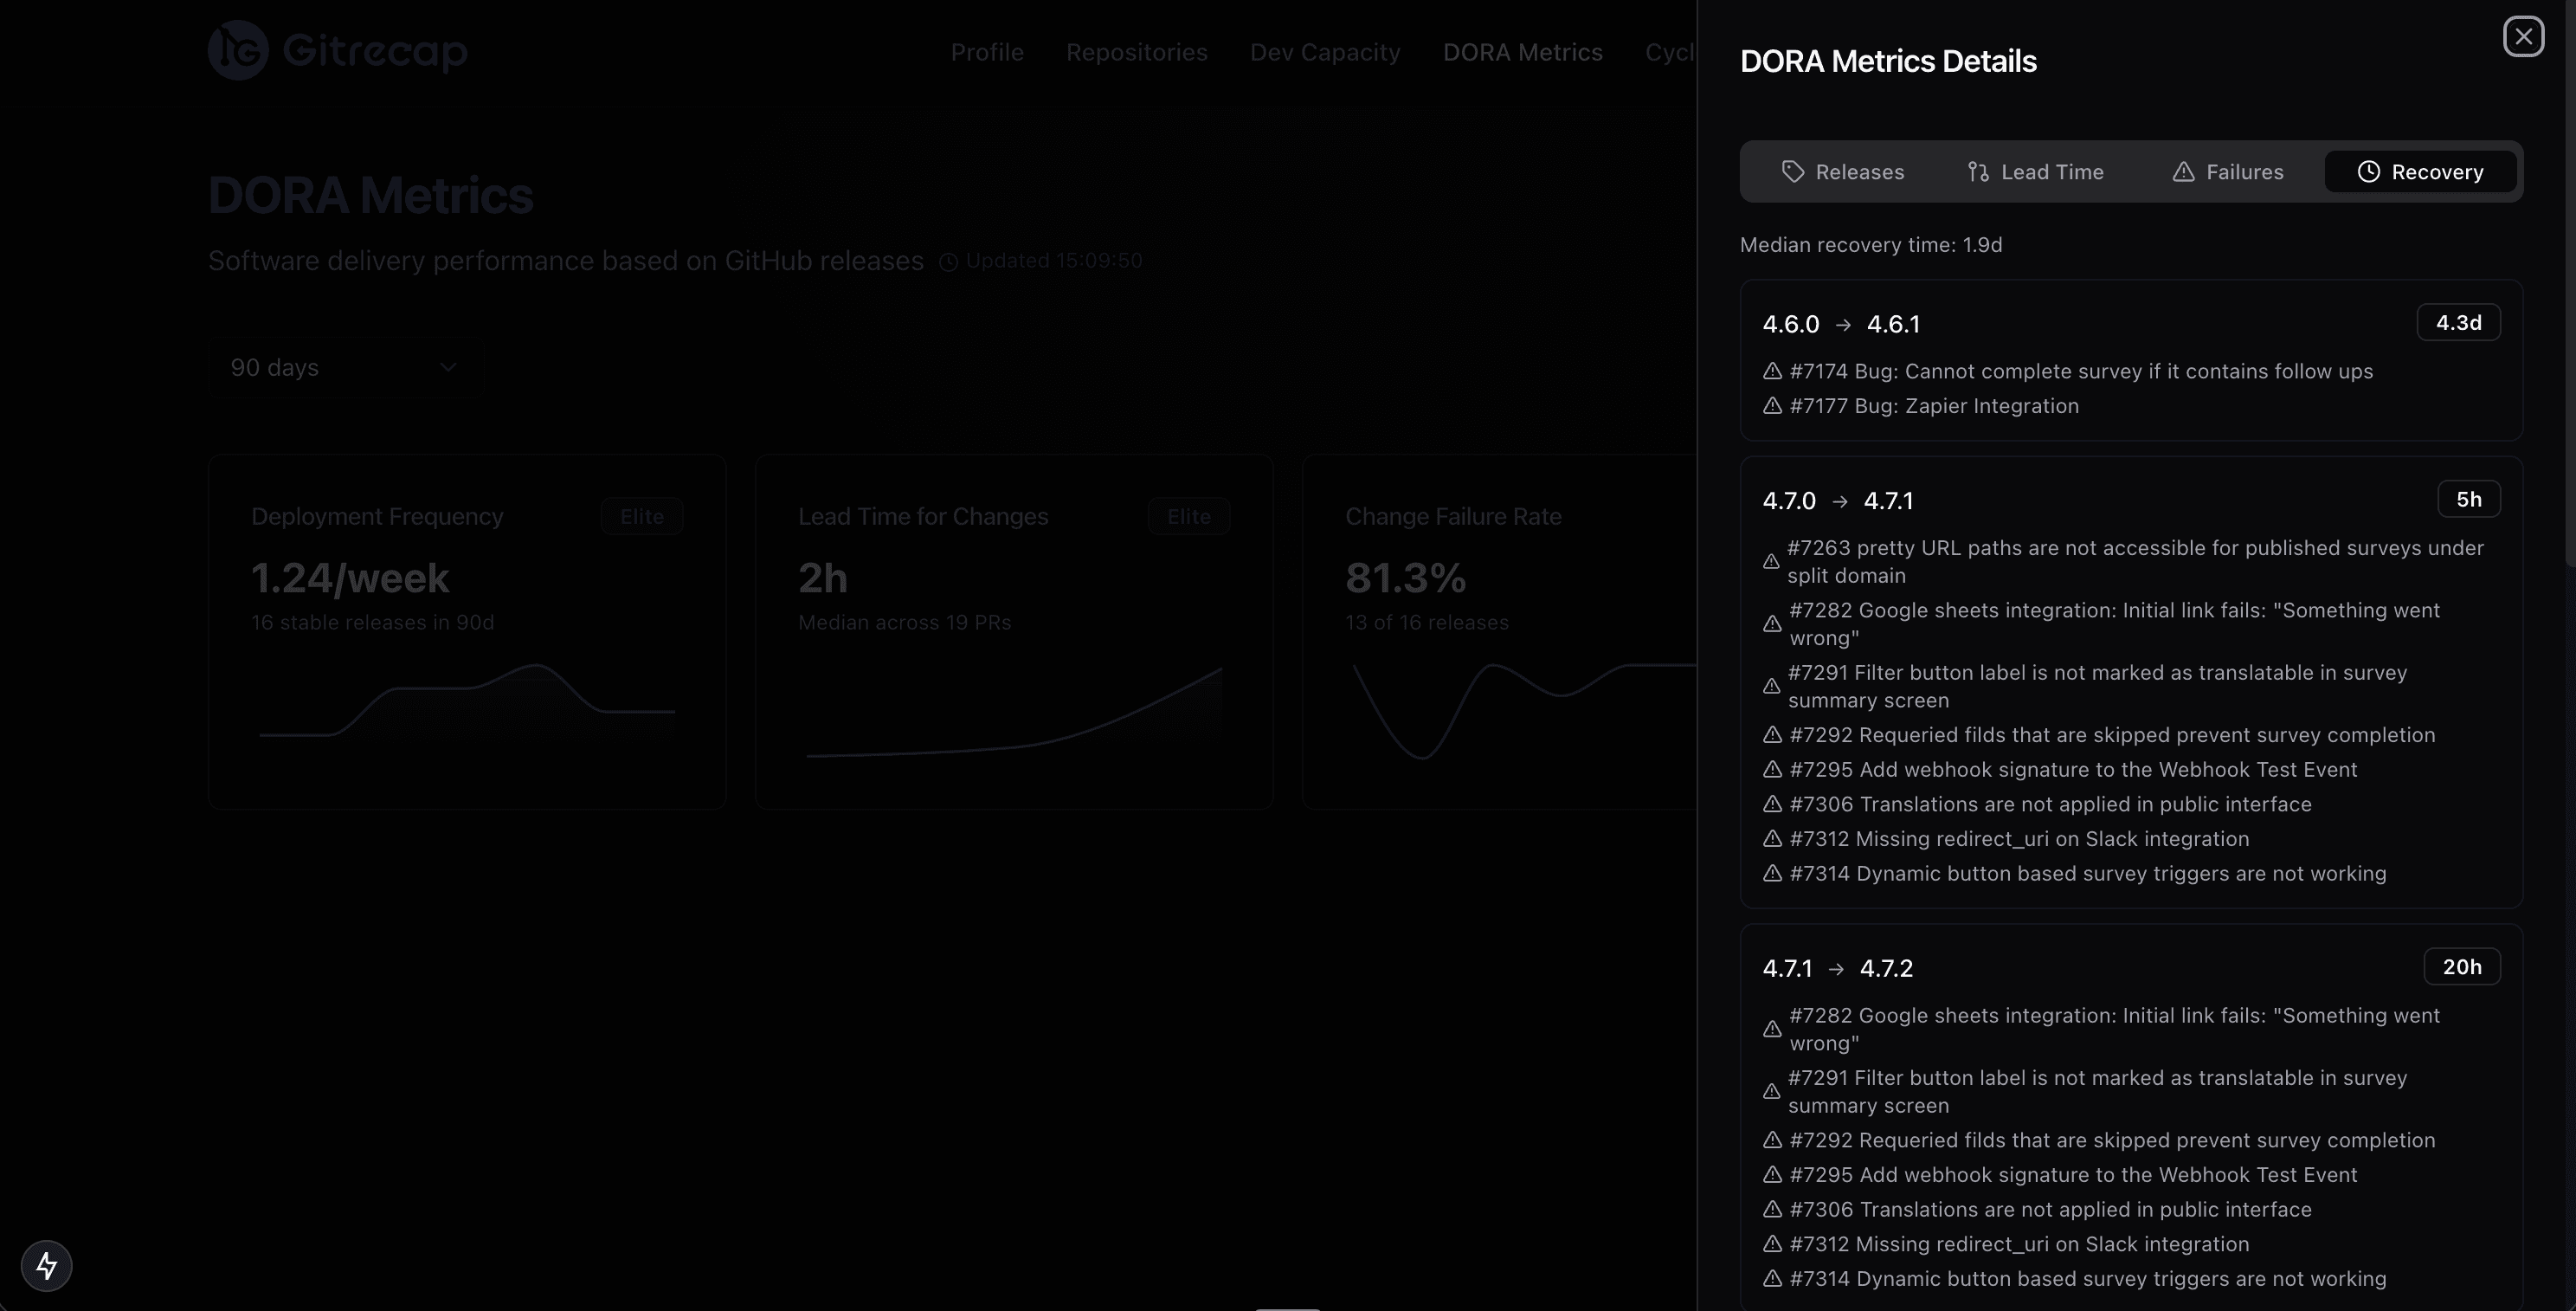
Gitrecap measures MTTR by tracking GitHub Issues labeled as incidents or outages. It records when the issue was opened (incident start), then identifies the next deployment to the affected repository after the issue was closed (recovery). The elapsed time between those two events is your recovery time for that incident. Mean time to recovery is the average across all incidents in your selected date window.
MTTR card showing mean and worst-case recovery time for the period.

A detailed log of every incident with open, close, and recovery timestamps.
Why Engineering Teams Track DORA Metrics
Most engineering organizations have a sense that delivery is too slow or that production incidents happen too often — but they lack the data to pinpoint the cause or measure whether improvements are working. DORA metrics change that. They give you a shared, objective language for software delivery performance that everyone from an individual contributor to the CTO can read and act on.
The DORA research is unambiguous: elite-performing teams don't trade speed for stability. They deploy more frequently and have lower failure rates than lower-performing teams. Tracking these metrics over time helps your team identify where friction lives — in long-lived branches, slow code reviews, fragile deployments, or incident response processes — and gives you a measurable target to improve against.
Gitrecap computes DORA metrics automatically from your GitHub data so your team can focus on acting on the numbers rather than collecting them. Reports can be delivered to Slack or email on a schedule, shared as PDFs in quarterly reviews, or pulled up on demand whenever you need a picture of where delivery stands.
How It Works
Connect Your GitHub Account
Sign up and authorize Gitrecap with read-only access to your GitHub account. Setup takes under two minutes and requires no code changes or CI/CD configuration.
Select Your Repositories
Choose which repositories to include in your DORA metrics dashboard. You can select individual repos or include your entire organization. There is no limit on the number of repositories.
View Your DORA Metrics Dashboard
Your dashboard populates immediately with historical data. Deployment frequency, lead time for changes, change failure rate, and MTTR are all calculated and displayed with benchmark comparisons and 30-day trend charts.
Get Insights Delivered to Your Team
Schedule automated DORA metric reports to Slack or email — daily, weekly, or both. Share PDF exports in sprint reviews and retrospectives. Generate on-demand reports for any date range to investigate specific periods.
Select any combination of repositories from your GitHub account or organization.
Configure your delivery schedule and channel in the settings panel.
Frequently Asked Questions About DORA Metrics
What are the 4 DORA metrics?
The four DORA metrics are: Deployment Frequency (how often you deploy to production), Lead Time for Changes (how long a commit takes to reach production), Change Failure Rate (the percentage of deployments that cause production failures), and Mean Time to Recovery (how long it takes to restore service after an incident). They were defined by Google's DevOps Research and Assessment team based on research across 39,000+ professionals over more than a decade.
How do you measure DORA metrics?
DORA metrics are measured from your deployment pipeline and version control data. Deployment frequency comes from release events. Lead time is calculated from the first commit on a branch to when it merges and deploys. Change failure rate divides failed deployments by total deployments. MTTR measures the time from a production incident being reported to the fix being deployed. Gitrecap calculates all four automatically using data from your GitHub repositories.
What is a good deployment frequency?
According to the DORA research, elite performers deploy to production multiple times per day. High performers deploy between once per day and once per week. Medium performers deploy between once per week and once per month. Low performers deploy less than once per month. Your target frequency depends on your release process, but the research consistently shows that higher deployment frequency correlates with better stability — not worse.
How is lead time for changes calculated?
Lead time for changes is the elapsed time from when a developer makes the first commit on a feature branch to when that change is running in production. In Gitrecap, this is calculated by tracking when a pull request's earliest commit was created, then measuring how long it took for that PR to be merged and included in a release. Shorter lead times — ideally under one hour for elite teams — mean faster delivery and tighter feedback loops.
What is change failure rate in DORA?
Change failure rate (CFR) is the percentage of your deployments that result in a degraded service or require a hotfix, rollback, or patch to fix. It is calculated as: (number of failed deployments) divided by (total deployments) × 100. Elite teams maintain a CFR of 0–5%. Gitrecap identifies failed deployments by tracking reverted pull requests, hotfix branches, and incident-labeled issues tied to recent releases.
How do DORA metrics improve team performance?
DORA metrics give engineering teams an objective baseline for software delivery performance. By tracking all four metrics together, teams can identify specific bottlenecks — whether they are shipping infrequently, taking too long to get changes out, breaking production too often, or recovering too slowly. Teams that regularly review their DORA metrics and take action on the findings consistently improve throughput without sacrificing stability.
Can I track DORA metrics with GitHub?
Yes. GitHub contains all the raw data needed to calculate DORA metrics: releases for deployment frequency, pull request timestamps for lead time, revert PRs and hotfix branches for change failure rate, and issue timelines for MTTR. Gitrecap connects directly to your GitHub account and computes all four DORA metrics automatically — no additional instrumentation, CI/CD integration, or manual data entry required.
What is the difference between DORA metrics and the SPACE framework?
DORA metrics focus specifically on software delivery performance — how fast and reliably a team ships code to production. The four metrics are quantitative and directly measurable from pipeline and version control data. The SPACE framework (Satisfaction, Performance, Activity, Communication, Efficiency) is broader, covering developer experience and team health dimensions that are harder to measure objectively, including satisfaction and collaboration quality. DORA metrics are the industry standard starting point; SPACE adds richer context around how individuals and teams feel about their work.
Start Tracking DORA Metrics Today
Connect your GitHub account and get your first DORA metrics dashboard in under two minutes. No credit card required.
Start Your Free Trial7-day free trial — No credit card required