PR Cycle Time Benchmarks 2026: What Elite Engineering Teams Achieve
Elite teams merge PRs in under 12 hours. Where does your team stand? Benchmarks from 8.1M+ PRs broken down by coding, pickup, review, and merge phases.
Why Benchmarks Matter for Engineering Cycle Time
Without external benchmarks, teams have no way to assess whether their cycle time is a process problem worth fixing or a reasonable baseline for their context. A team that averages 3 days from first commit to merge might celebrate the improvement from their previous 7-day average — not realizing that high-performing teams at similar scale operate at under 12 hours.
Benchmarks do not tell you what is possible in theory. They tell you what similar teams are actually achieving in practice. That distinction matters: a benchmark drawn from 8.1 million real pull requests, as LinearB's dataset provides, reflects the full distribution of software teams — startups and enterprises, product teams and infrastructure teams, greenfield projects and decade-old codebases.
The goal of benchmarks is not to manufacture pressure or create arbitrary targets. It is to provide an honest external reference point so teams can make informed decisions about where to invest improvement effort. A team in the low tier for pickup time knows where to focus. A team already in the elite tier for coding time can redirect attention elsewhere.
Data sources used in this article: LinearB's Engineering Benchmarks Report (analysis of 8.1 million pull requests), the Google DORA State of DevOps Report (annual industry research), and supplementary data from GitHub's own engineering research publications. All benchmarks reflect median values within each performance tier.
These benchmarks are targets to move toward, not mandates to meet immediately. The appropriate use is to identify your current tier, set a realistic goal for the next quarter, and track weekly progress against that goal. For a complete explanation of how cycle time fits into broader engineering performance measurement, see our guide on what are DORA metrics.
Complete PR Cycle Time Benchmark Table (2026)
The table below consolidates benchmarks for all four PR cycle time phases across four performance tiers. These figures reflect median values within each tier, not best-case outliers.
| Phase | Elite | High | Medium | Low |
|---|---|---|---|---|
| Coding Time | < 6 hours | 6 – 24 hours | 1 – 5 days | > 5 days |
| Pickup Time | < 1 hour | 1 – 5 hours | 5 – 24 hours | > 24 hours |
| Review Time | < 4 hours | 4 – 12 hours | 12 – 48 hours | > 48 hours |
| Merge Time | < 1 hour | 1 – 3 hours | 3 – 12 hours | > 12 hours |
| Total Cycle Time | < 12 hours | 12h – 2 days | 2 – 8 days | > 8 days |
Source: LinearB Engineering Benchmarks Report. DORA defines the same four performance tiers (Elite, High, Medium, Low) for measuring engineering delivery performance — these cycle time benchmarks map directly onto that framework.
Gitrecap plots your team's cycle time averages against industry benchmarks, making tier classification immediate and unambiguous.
Coding Time Benchmarks — How Long Should Development Take?
Coding time is the phase most directly under the developer's control. It reflects decisions made before a single line of code is written: how large the PR will be, how well the requirements are understood, and how experienced the developer is with the relevant area of the codebase.
- Elite (< 6 hours): PRs are small, focused, and built from clear specifications. Developers work in short increments, often using stacked PRs or feature flags to ship partial work continuously.
- High (6 – 24 hours): PRs are reasonably sized. Requirements are generally clear. Some exploration or discovery adds time, but work is still progressing at a healthy rate.
- Medium (1 – 5 days): PRs tend to be larger, often encompassing multiple related changes. Requirements may be partially unclear, leading to discovery during implementation. This is the most common tier for teams that have not deliberately invested in PR size discipline.
- Low (> 5 days): PRs are very large or work is frequently interrupted. Feature branches accumulate changes over many days before being opened for review. This tier is associated with high rates of merge conflicts and context loss during review.
The primary driver of coding time is PR scope. Requirement clarity is secondary. Developer experience with the codebase matters at the margins but is rarely the bottleneck. Teams that move from medium to elite on coding time almost always do so by establishing and enforcing a PR size target — typically 400 lines of changed code or fewer — rather than by improving developer speed.
Key insight: Coding time is mainly about PR size discipline. Requiring smaller, more frequent PRs is the most reliable path to elite coding time benchmarks, regardless of team size or technology stack.
Pickup Time Benchmarks — How Fast Should Reviews Start?
Pickup time is the interval between a PR being opened and the first review interaction. Among the four phases, it is the most improvable — the changes required are behavioral and organizational, not technical — and it often has the largest absolute impact on total cycle time.
- Elite (< 1 hour): Review is treated as a scheduled, high-priority activity. Reviewers are assigned immediately at PR opening, and teams have working agreements that establish a pickup time SLA.
- High (1 – 5 hours): Reviews happen same-day in most cases. There may not be a formal SLA, but cultural norms around responsiveness keep pickup time low.
- Medium (5 – 24 hours): Reviews typically happen within a business day, but PRs opened in the afternoon may not receive attention until the following morning. This is the most common tier and often represents an improvable baseline.
- Low (> 24 hours): PRs routinely sit for more than a day before any reviewer engages. This typically indicates that review is low-priority relative to individual coding work, or that reviewer assignment is unclear.
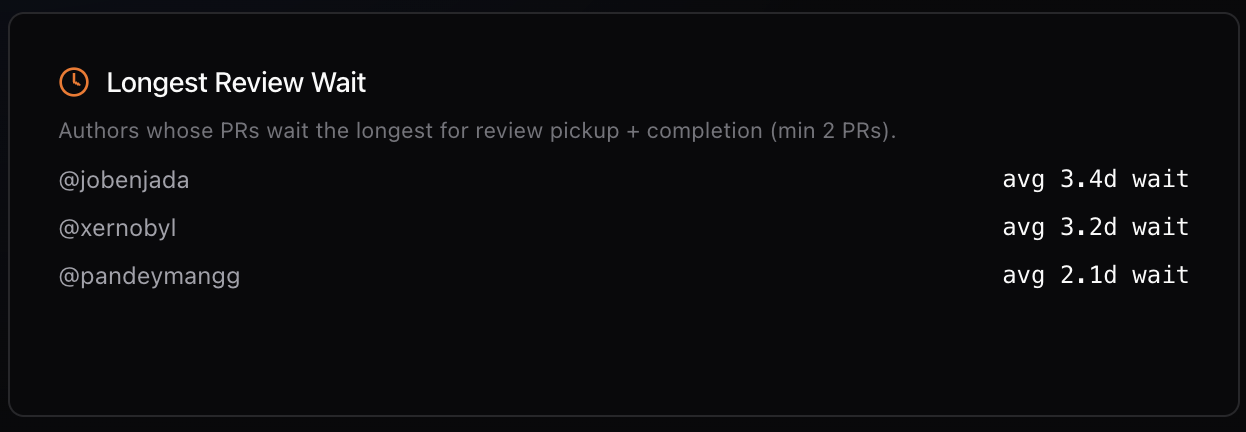
Pickup time broken down by author reveals whether long wait times are distributed evenly or concentrated on specific contributors.
Three strategies reliably reduce pickup time:
- Dedicated review time blocks: Schedule two fixed windows per day for code review — for example, 9:30 AM and 2:00 PM. No PR opened during business hours should wait more than a few hours for a first look.
- Reviewer assignment bots: Use tools like GitHub's CODEOWNERS file or reviewer assignment automation to immediately assign a reviewer at PR creation. Unassigned PRs are easy to ignore; assigned ones create accountability.
- Smaller team review zones: In larger organizations, assigning review responsibility to small sub-teams (3-5 people) rather than the entire engineering org produces faster pickup times by creating clear ownership without overwhelming any individual.
LinearB's data shows that teams implementing a formal pickup time SLA of 2 hours or less see an average 40% reduction in total cycle time within 60 days of adoption.
Review Time Benchmarks — How Long Should Code Review Take?
Review time covers the full span of back-and-forth between author and reviewers, from the first review comment to the point the PR receives its final approval. This phase is influenced by PR size, PR description quality, reviewer expertise, and team review culture.
- Elite (< 4 hours): Reviews are typically single-pass or at most two rounds. PRs are small and well-described. Reviewers have context and can provide actionable feedback quickly. Most revisions are minor.
- High (4 – 12 hours): Reviews may go through two or three rounds but resolve within a business day. Feedback is constructive and specific. Authors address comments promptly.
- Medium (12 – 48 hours): Reviews often span more than one day. Multiple rounds of revision are common. PRs may be large or lack sufficient description, leading to clarification questions that extend the timeline.
- Low (> 48 hours): Reviews take multiple days. Revision cycles are numerous. PRs may be very large, requirements may be unclear, or there may be fundamental disagreements about implementation approach that are resolved through review comments rather than upfront design discussions.
The 3x review time penalty for PRs over 400 lines is one of the most consistently replicated findings in engineering productivity research. Reviewers become less effective at large PR sizes — they lose track of the overall change, miss interactions between modified sections, and spend more time reconstructing context than evaluating the code. Small PRs receive better reviews faster, not just faster reviews.
The distinction between multiple review rounds versus single-pass approval is also significant. Teams that front-load alignment — through design documents, RFC processes, or draft PR feedback — before full implementation produce PRs that are approved in one or two rounds rather than four or five.
Merge Time Benchmarks — From Approval to Production
Merge time is the final phase: the interval between the last approval being granted and the PR being merged into the base branch. This phase should be minimal by design. If it is not, the cause is almost always a process or tooling issue, not a people issue.
- Elite (< 1 hour): Auto-merge is enabled. PRs merge automatically once all required checks pass and approvals are in place. Human intervention is not required in the normal case.
- High (1 – 3 hours): Most merges happen quickly after approval, but CI checks take some time to run. Developers may need to manually trigger the merge but do so promptly.
- Medium (3 – 12 hours): Approved PRs wait for manual action from the author or a designated maintainer. If the author has moved on to other work, the merge may be delayed by hours.
- Low (> 12 hours): Approved PRs sit unmerged for extended periods. This often indicates unclear ownership of the merge action, infrequent CI runs, slow CI pipelines, or external approval gates (change control processes, scheduled merge windows) that are not visible in the PR metrics.
The diagnostic questions for high merge time are straightforward:
- Is auto-merge enabled? If not, enable it for approved PRs with passing required checks.
- How long do CI pipelines take? If required checks take 30+ minutes, merge time accumulates even with auto-merge. Parallel test execution and selective test running are the primary optimizations.
- Are there manual gates? Change approval processes, security reviews, or scheduled deployment windows add merge time that is not visible as a process problem but appears as a metrics problem.
Branch protection rules that require specific reviewers, multiple approvals, or passing status checks from slow CI jobs are common causes of elevated merge time in otherwise high-performing teams. Auditing these rules for necessity — removing requirements that no longer serve a clear purpose — is often the fastest path to reducing merge time.
How Teams Move from Low to Elite
The path from low to elite cycle time performance is not a single transformation. It is a sequence of phase-by-phase improvements, each building on the last. Teams that try to fix everything at once rarely sustain the changes. Teams that focus on one phase at a time, measure the impact, and then move to the next consistently improve over 3-6 months.
A practical improvement playbook, in order of expected impact for most teams:
- Establish a pickup time SLA (week 1 – 2). This is the fastest win. Agree as a team on a first-review target — 2 hours is a good starting point — and track it weekly. Most teams see immediate improvement simply from making the expectation explicit.
- Set a PR size target (month 1). Define the maximum PR size your team will target — 400 lines of changed code is the research-backed threshold — and make it a working agreement rather than a hard rule. Track average PR size alongside cycle time.
- Establish review time blocks (month 1). Move review from opportunistic to scheduled. Two fixed windows per day, treated as non-negotiable as a standup, dramatically improve both pickup time and review time.
- Enable auto-merge (month 1 – 2). Remove the manual merge step for PRs that have all required approvals and passing CI checks. This eliminates merge time for the straightforward case entirely.
- Introduce draft PRs for complex work (month 2 – 3). Build the habit of opening draft PRs before significant implementation work to surface alignment issues early, reducing multi-round revision cycles.
- Optimize CI pipeline speed (month 2 – 3). If merge time or total cycle time is still elevated after other changes, investigate CI pipeline duration. Parallelization, caching, and test selection can often halve pipeline times.
- Review and track weekly (ongoing). Sustainable improvement requires visibility. Teams that review their cycle time metrics in a weekly engineering sync — noting what changed and why — improve faster and maintain improvements longer than teams that track metrics without reviewing them. Use Gitrecap's Cycle Time dashboard to make this review a 5-minute agenda item rather than a reporting exercise.
For broader context on how cycle time fits into a complete engineering performance framework, see our guide on DORA metrics benchmarks, which covers deployment frequency, change failure rate, and mean time to recovery alongside cycle time and lead time.
Measure Your Benchmarks Automatically
Knowing the benchmarks is only useful if you can measure your own team against them consistently. Manual measurement — pulling timestamps from GitHub, calculating phase durations in a spreadsheet, maintaining a running average — is accurate when done carefully, but it is time-consuming and easy to neglect when other priorities compete.
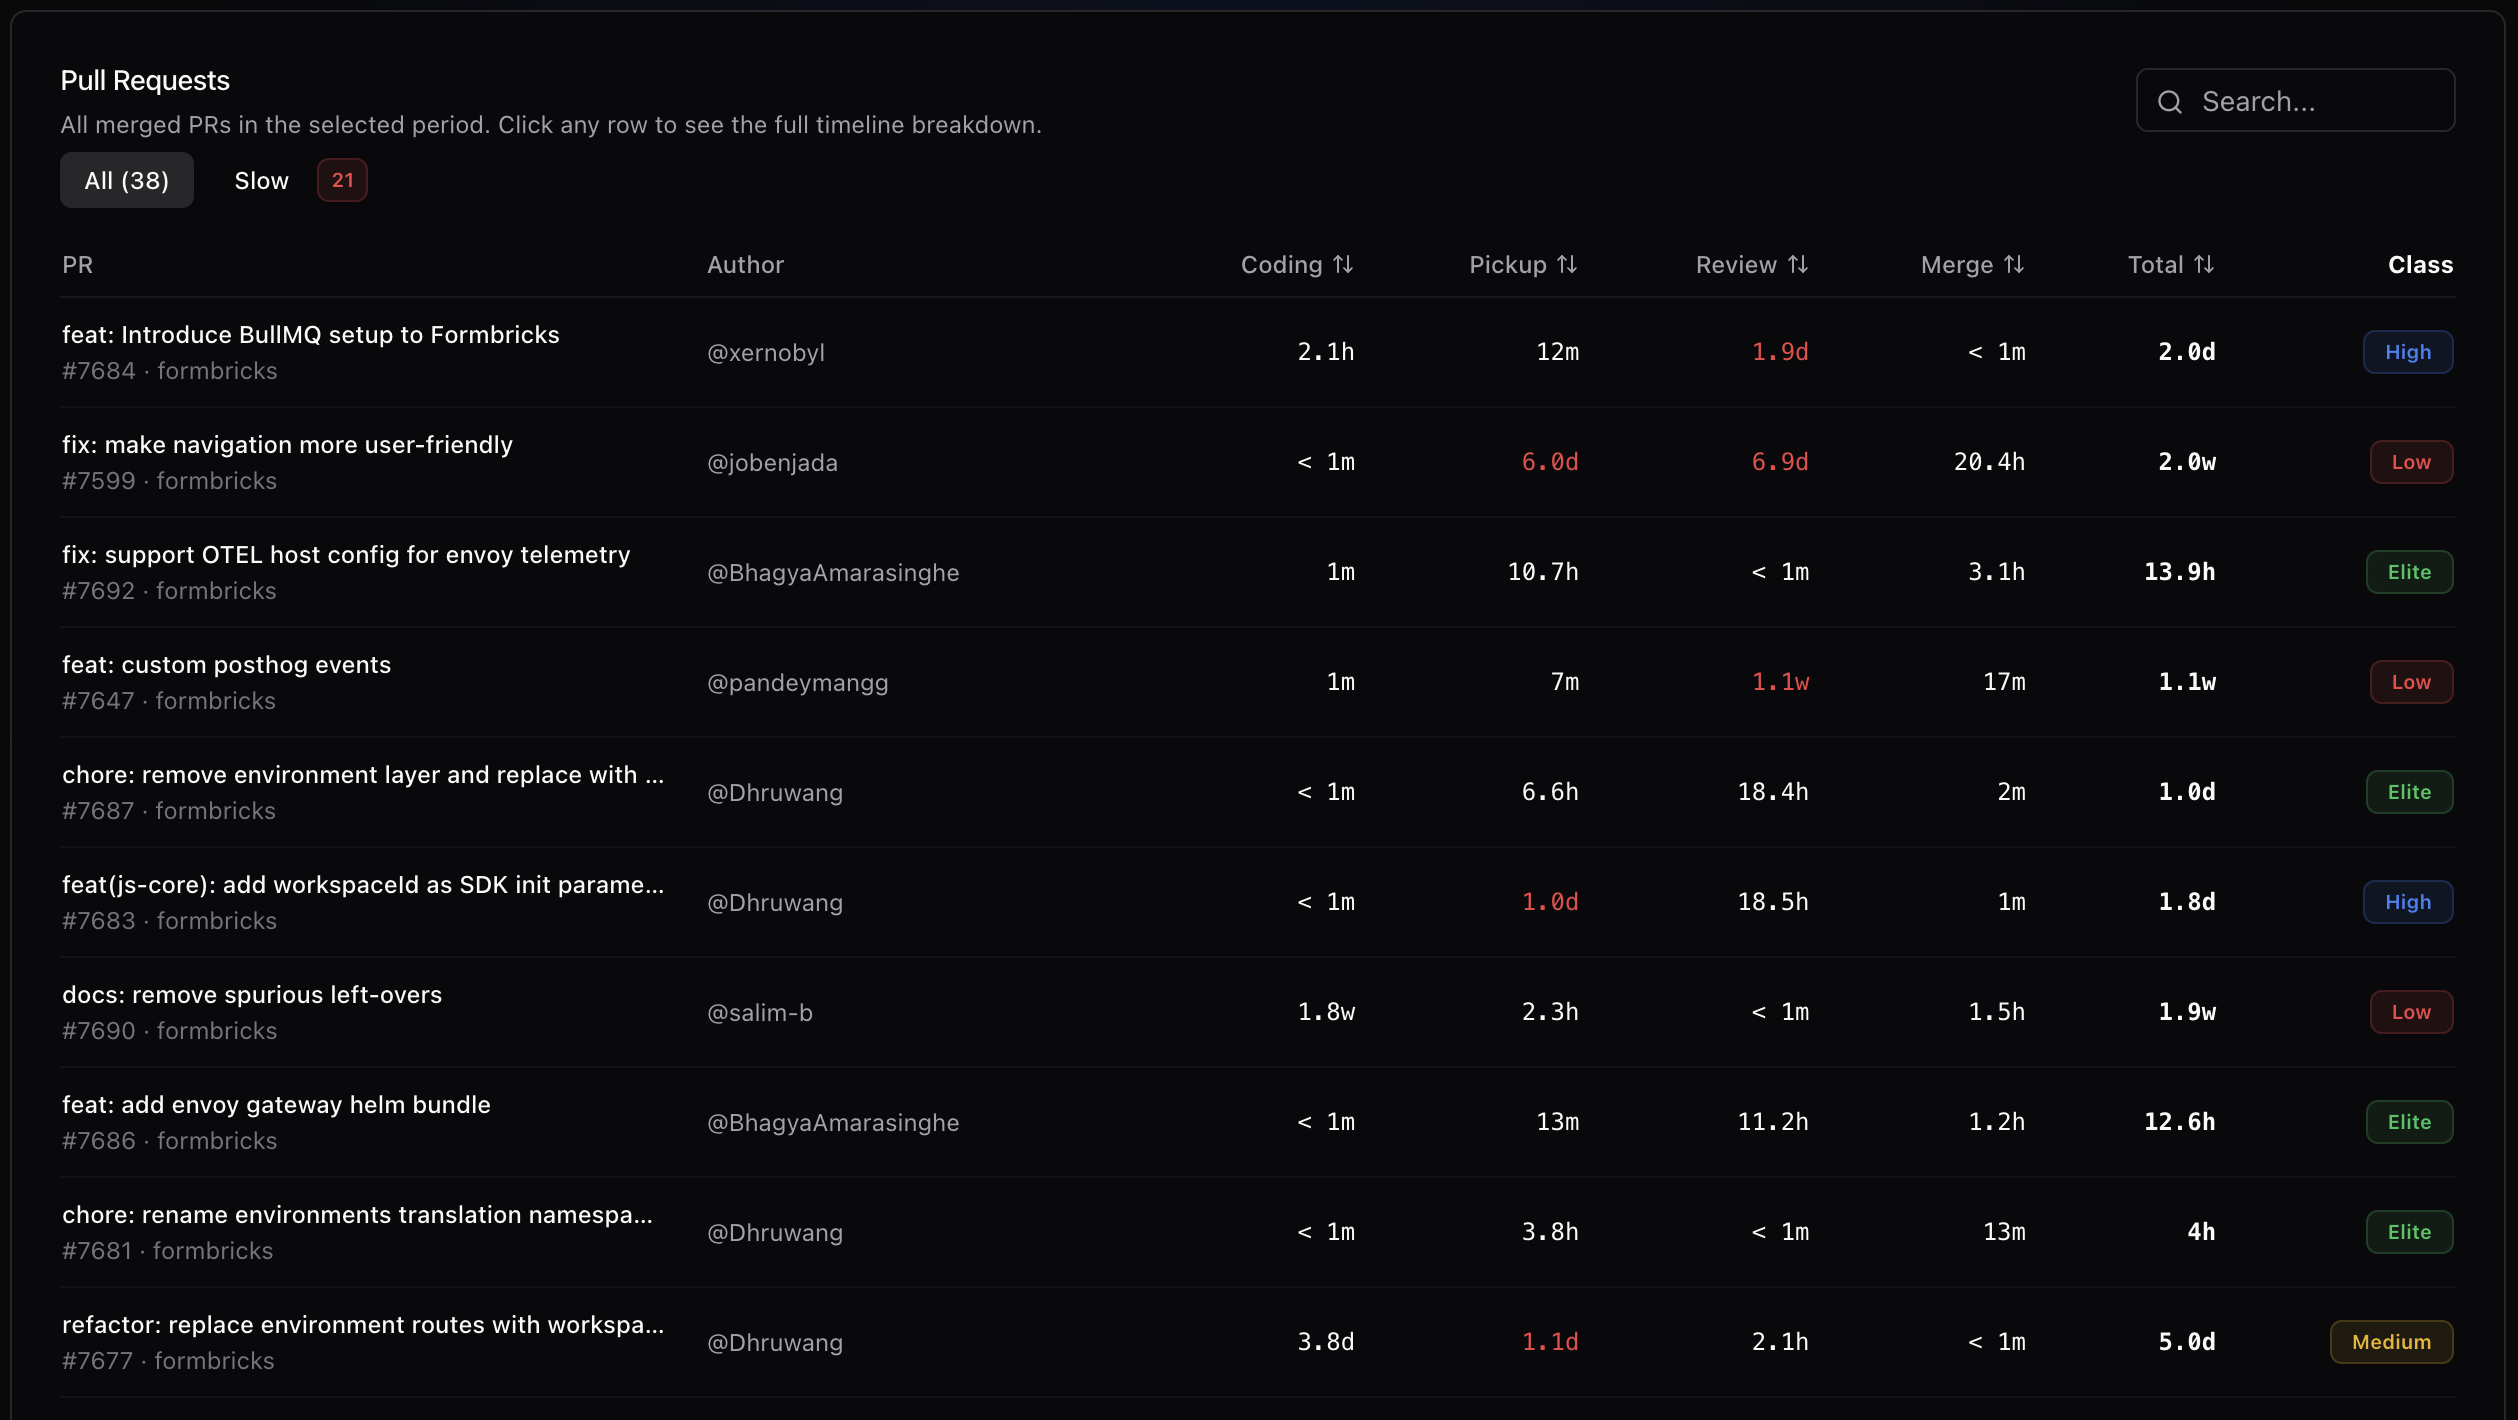
Gitrecap's Cycle Time dashboard automatically classifies every merged PR into the appropriate benchmark tier for each phase. Every PR is analyzed from first commit through pickup, review, and merge, and the results are displayed with trend lines, per-author breakdowns, and outlier highlighting. When a PR falls into the low tier for any phase, it is surfaced automatically so the team can investigate whether a pattern is forming.
Every PR is automatically classified against industry benchmarks. Outliers and patterns are surfaced without manual analysis.
Connect your GitHub repositories and your first cycle time benchmark report is ready within minutes. No scripts, no spreadsheets, no API keys to manage. The classification updates automatically as new PRs merge, giving your team a continuously current view of where you stand relative to elite, high, medium, and low performance tiers.
Ready to Automate GitHub Activity Tracking?
If you'd like to automate GitHub activity tracking, try Gitrecap — no sign-up required.
Related Articles
How to Track GitHub Activity Like Jira (Without the Complexity)
Tired of complex project management tools? Discover how to track GitHub activity with Jira-like visibility using simple, automated reporting tools.
5 Free Tools to Track GitHub Team Activity Automatically
Discover the top 5 free tools that automatically track GitHub team activity, helping you monitor productivity without manual work.